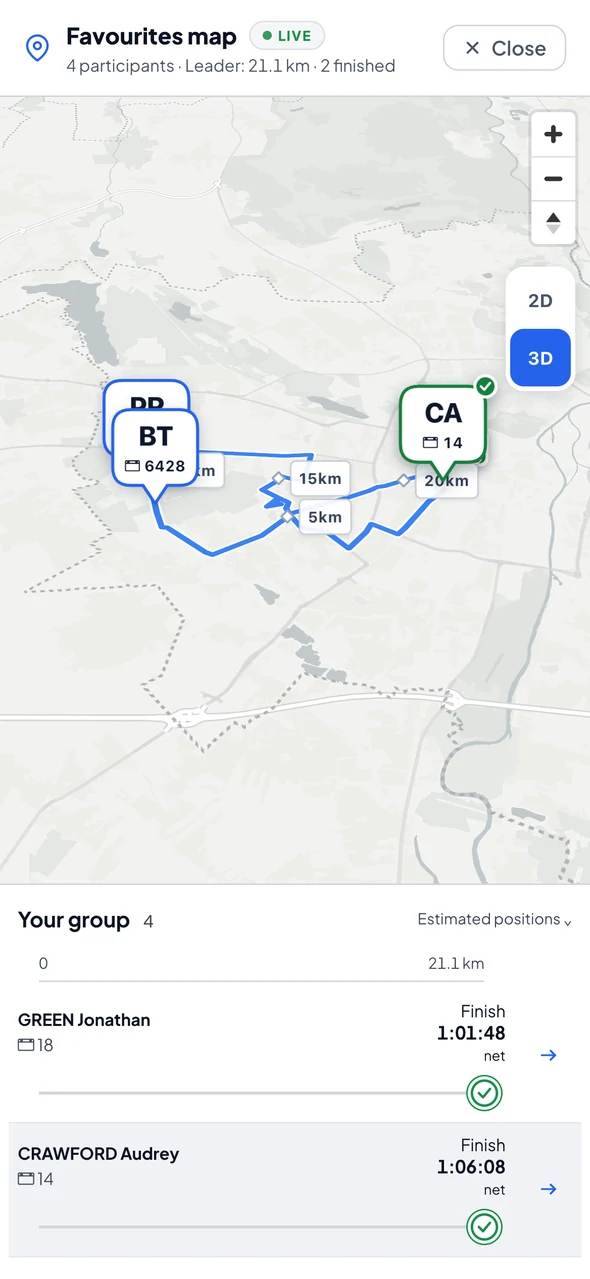
RaceTime estimates where each runner is between timing points from their pace, moves the marker smoothly and corrects it at every recorded split - on an angled 3D map that follows road courses, triathlon legs and lap circuits.
The course is drawn from your uploaded route; each athlete's marker advances along it, interpolated from their splits and expected pace. Checkpoints are pinned, crossed splits tick green, and the marker glides between reads instead of teleporting from one timing point to the next.
One map handles every course shape: the map is no longer point-to-point only. Multi-stage events draw every leg, and lap races circulate the whole loop - all from the same component.
Triathlon and other multi-stage events draw the full course - swim, bike, run - each leg in its own colour, with the marker following the athlete's active leg.
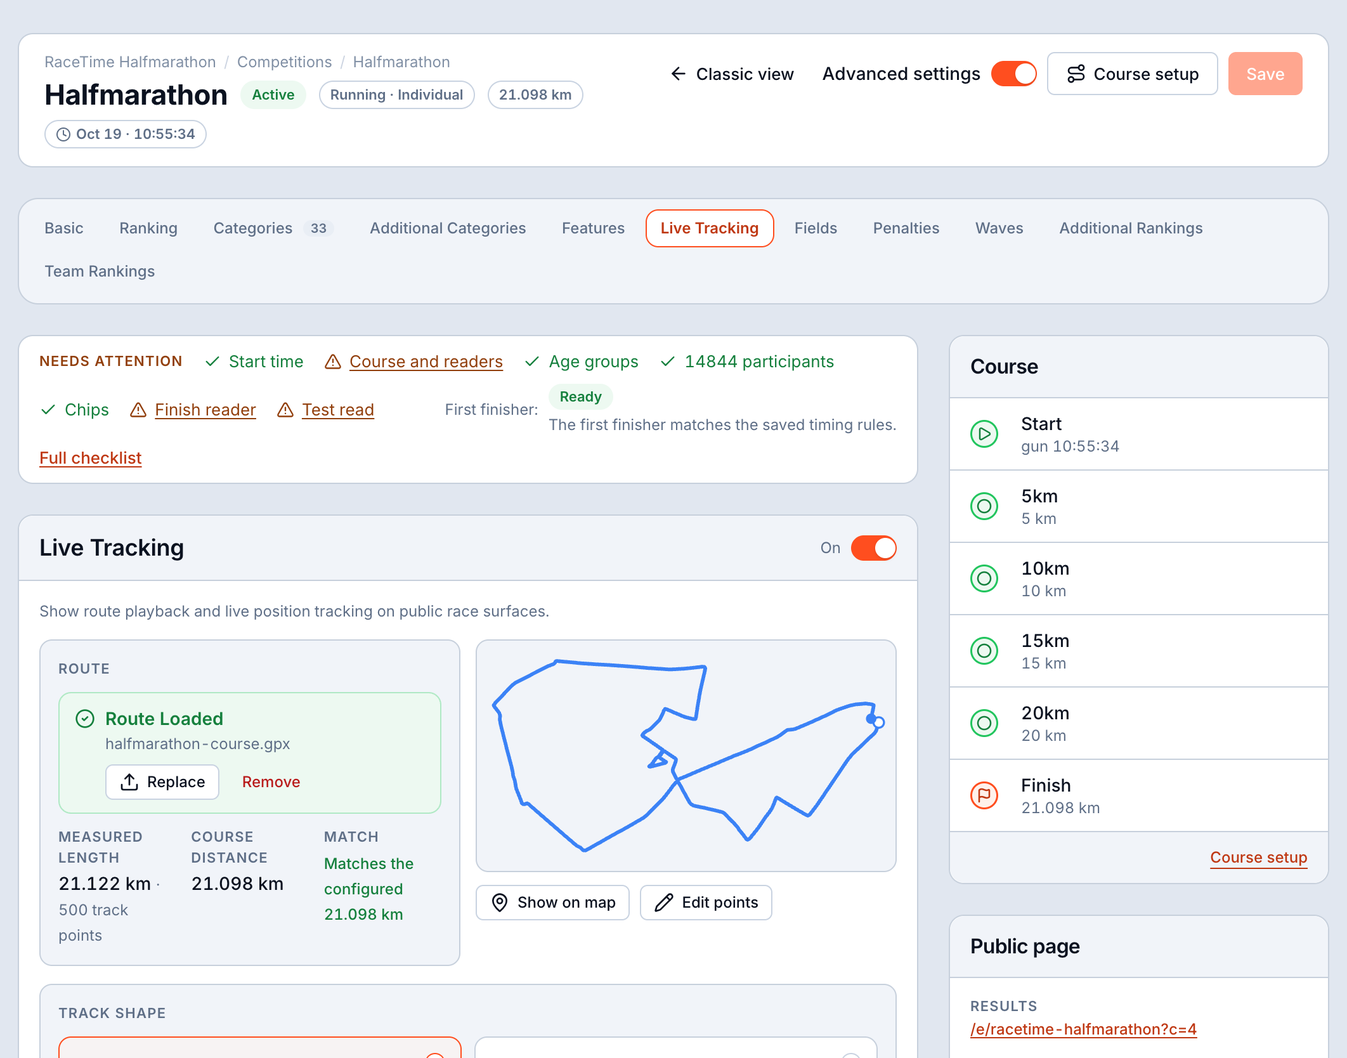
Upload one lap, set the length and lap count, and the map draws the athlete circulating the whole multi-lap course - the map distance stays decoupled from scoring so the dot traverses the full loop.
Some legs move a live dot (bike, run); others are drawn as an informative outline only (swim, transitions). It's operator-configurable per leg, not hardcoded by discipline.
Families and clubs rarely follow one athlete. The spectator tools are built around watching several at once - and around the storytelling that makes a lead group exciting.
Track several athletes on one map at once, each with their own marker and live within-leg distance - and every favourite's card ticks forward between reads, just like the leader.
A "ghost" dot chases the course record split-by-split and gender-aware - instant live-sports storytelling for the lead group, no commentary required.
Tracking lives right inside the public athlete profile and the favourites view, so spectators move between the results list and the map without leaving the page.
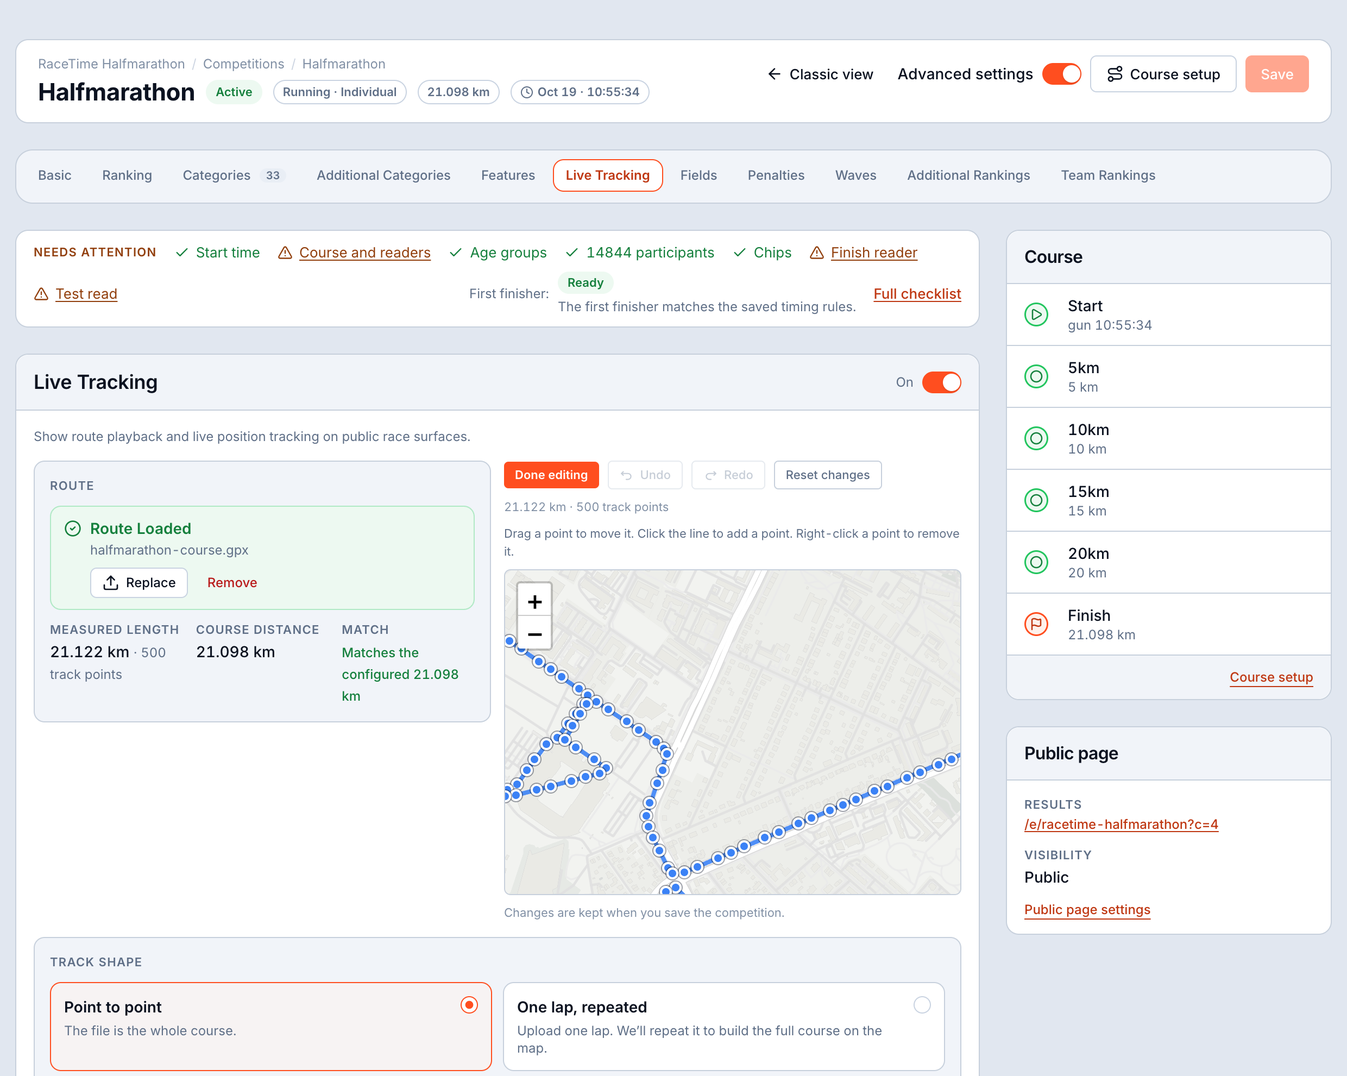
Tracking is a per-competition tab. Operators drag in a course file and the map takes care of the rest - including an instant preview before anything goes live.